
LinkedIn Report Template
Why Your Agency Needs a LinkedIn Report Template
A LinkedIn reporting template is a must-have tool to reduce manual work and create a streamlined process. It’s a visual way to share your client’s LinkedIn analytics, highlight key trends, and present complex data in a digestible format.
This report template includes pre-set sections specific to LinkedIn campaigns, both for organic and paid efforts. It eliminates the need to create reports from scratch, which makes this template easily replicable for other client campaigns. If further customization is needed, rearrange metrics as required and add data from 80+ platforms.
Plus, it’s a way to create consistency across the board. This LinkedIn analytics report is white-labeled, which elevates your professional image and overall branding efforts.
In essence, a LinkedIn report template optimizes productivity, enhances professionalism, and saves those precious billable hours. That way, your agency upgrades the entire reporting experience, all while maintaining client satisfaction.
Create Professional LinkedIn Reports in Minutes
Start Your Free Trial Today
13 Key Sections Included in a LinkedIn Report
1. Cover Page
A professionally designed cover page sets the tone for any report template. It incorporates your agency’s branding (i.e., your logo and unique colors), which ensures uniformity across all collateral.
Needless to say, a custom cover page creates a favorable first impression and encourages clients to delve deeper into their LinkedIn analytics. This extra step enhances the perceived value of the report’s content, which builds agency-client trust over time.

As a best practice, a cover page should clearly state the time range (i.e., the exact dates LinkedIn campaigns were run). This detail provides context off the bat and lets clients know what to expect.
Plus, a well-designed cover page saves time during the overall reporting process. In a few clicks, apply this cover page across other client reports and make minimal adjustments as needed.
2. Executive Summary
After a cover page, include a succinct executive summary. This section provides a concise overview of the most critical insights, allowing decision-makers to grasp takeaways without diving into the details.
It ensures the most important information is top-of-mind, which enables a quick understanding at first glance. At the same time, it solidifies the report’s overall impact and gets straight to the point.

3. Follower Growth
Follower Growth shows whether your client’s campaigns actually get users to subscribe to their LinkedIn pages. More specifically, it’s a way to assess the effectiveness of LinkedIn content strategies, ad copy, and messaging.

An upward trend in followers often correlates with enhanced brand visibility and traction, which is a good sign. With more followers, there's typically more engagement on posted content, which leads to more meaningful interactions over time.
4. Organic vs. Paid New Followers
Tracking the split between Organic vs. Paid New Followers ensures an optimal mix between both types of campaigns. Use this data to understand which efforts contribute the most to follower acquisition on your client’s LinkedIn pages.

For example, a client’s LinkedIn ads may not rake in as many followers as their organic efforts. In this scenario, consider making improvements like optimizing ad copy or using a different bidding strategy.
5. Engagements
Engagements quantify interactions such as Likes, Comments, Shares, and Clicks on LinkedIn content. It shows how actively users are interacting with LinkedIn ads or organic posts.

It’s a way to evaluate whether content resonates with your client’s audience. A high engagement rate shows content or strong ad potency, which increases the chances of Conversions.
Essentially, this metric pinpoints what content leads to the most interaction, which is useful for future LinkedIn strategies.
6. Google Analytics Social Media Breakdown
A Google Analytics social media breakdown shows how individual platforms contribute to website activity. It’s a neat way to present a cross-channel comparison and show the impact of LinkedIn campaigns beyond the platform itself.

More specifically, this breakdown includes engagement metrics like Session Duration, Bounce Rate, and Conversions. It also identifies the social media platforms that generate the most traffic and website-related results.
7. Impressions
Impressions show the overall reach of LinkedIn campaigns. In a nutshell, it measures brand exposure and indicates how often your client’s LinkedIn posts appear on user feeds.

While Impressions don’t always translate to user engagement (like Clicks), these post analytics reflect whether the content is visible in the first place. If there’s a low number of Impressions, it may mean creating more relevant content, refining targeting, or increasing ad spend.
Don’t Waste Another Billable Hour on Manual Reporting!
Try AgencyAnalytics Free for 14 Days8. Click-Through Rate (CTR)
CTR is a direct measure of user interest and gives more insight into the appeal of a LinkedIn post or ad. A higher CTR suggests that the content entices users to learn more, which is a promising sign for further engagement.

To address low CTRs, ensure there’s a sufficient amount of Impressions to begin with. If so, work on optimizing ad placements, fine tuning copy, and creating click-worthy subject lines.
9. Cost per Click (CPC)
CPC quantifies how much your client pays each time a user clicks one of their LinkedIn ads. It’s a critical metric for managing budgets and understanding the financial performance of paid campaigns.

A lower CPC is an ideal scenario, as it generates more clicks for your client’s ad spend. On the other hand, a higher CPC may result in increased costs with minimal ROI. This scenario should prompt a reassessment of your client’s bidding strategy, target keywords, and ad objectives.
10. Conversions
Conversions show how many users take concrete actions after viewing your client’s LinkedIn posts or ads (e.g., downloading an eBook or registering for a webinar). In other words, this metric shows whether LinkedIn campaigns turn initial interest into something more tangible.

A high number of Conversions indicates effective messaging and content, which is what any client wants to see. To address a low number of Conversions, make calls to action more compelling, use action-oriented keywords, and reiterate the value of whatever your client is offering.
11. Total Ad Cost
Share exactly how much was spent on LinkedIn campaigns by including the total ad cost. Use this data to evaluate budget allocation and assess campaign ROI.

Including the total cost lets clients know how their funds were used, which helps them make informed financial decisions. Assessing whether this total cost resulted in desired outcomes (like increased lead generation or Conversions) is also helpful.
12. Demographics
Demographics are vital to any client’s LinkedIn analytics report, as it shows who’s interacting with their LinkedIn pages, posts, or ads. It ensures their target audience is reached while uncovering new segments and opportunities.

To uncover the most valuable insights, break down key metrics (like CTR, CPC, and Conversions) by:
Industry
Job Function
Seniority Level
Country or Region
In doing so, your clients will understand the most viable demographics and which segments to focus on.
13. PPC Markup
A PPC markup is the percentage your agency adds to a client’s PPC campaigns, which covers ad management and operational costs. Including this information in a LinkedIn report ensures transparency in client billing, which builds trust over time.

This data helps your agency justify service fees, especially if there’s favorable ad performance and a track record of achieved results.
Use a Customizable LinkedIn Report Template To Meet Client Needs
In the early days, it was possible to get by with copying and pasting LinkedIn data into Google Sheets or Excel. Alternatively, a tool like Looker Studio (formerly Google Data Studio) may do the job for a small client base. As your agency grows, though, it’s exceedingly frustrating to deal with program crashes or excessive manual work.
Plus, it’s time-consuming to log into each client’s LinkedIn Campaign Manager account when juggling a full roster. Not to fret, there’s no need to rely on outdated methods–simply use a customizable LinkedIn report template in AgencyAnalytics.
With a few clicks, drag and drop widgets to create the report you’ve envisioned. Got insights to include from other marketing efforts? Easily import data across multiple sources and add them to the report–it’s that simple.

Even if you’ve got insights to include outside of these 80+ pre-built integrations (like a client’s budget forecast), don't worry. Use the Google Sheets integration to import data, create in-platform graphs, and much more!
Take manual reporting woes out of the equation. Instead, invest in an all-in-one tool that does the heavy lifting for you.
I love it. You log in once, and AgencyAnalytics does the rest. The information is always up to date, and with the template builder for reports and dashboards, reporting to clients becomes very straightforward.

Abigail Jessurun
Brandstax
Spend More Time on Strategy, Less Time on Client Reporting
Try AgencyAnalytics FREE for 14 Days!LinkedIn Report Templates as Unique as Your Agency
Streamline Your Workflow
Instantly Access All Your Clients’ LinkedIn Data
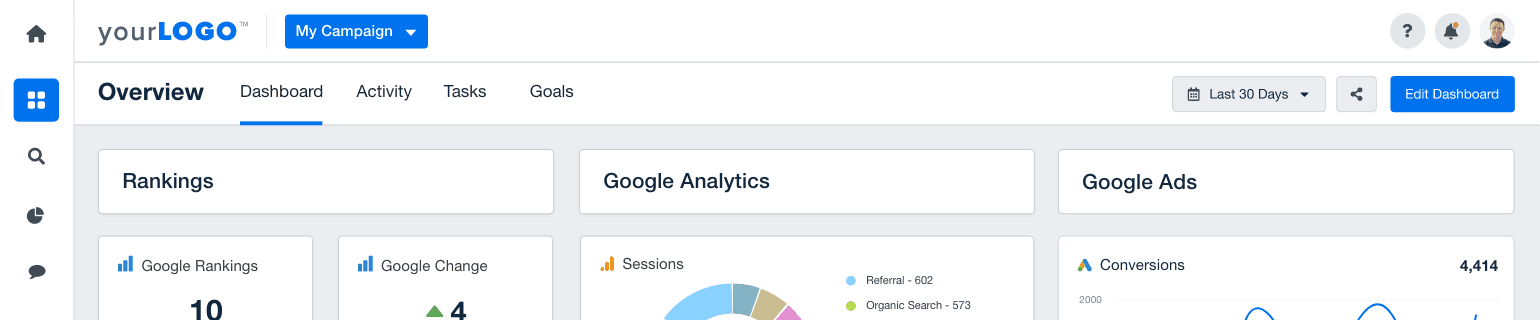
Struggling to manage data from multiple sources? Use AgencyAnalytics as a centralized hub and quickly access data across 80+ marketing platforms.
No more logging into LinkedIn Campaign Manager or various analytics tools. Consolidate those metrics in one place for a more time-efficient, accurate analysis.

Effortless Reporting
Create LinkedIn Reports in Minutes–Not Hours
Focus on clients and strategy, not spreadsheets. Invest in a tool that automates data retrieval and significantly reduces preparation time. Drag and drop widgets, rearrange metrics, and explore different data visualizations–the possibilities are endless.

Brand It Your Way
White Label Your LinkedIn Reports
Customize client reports with your logo, brand colors, and unique styling. Offer a seamless experience that ensures recognition at each touchpoint.
Data doesn’t have to be blah. Add some pizazz and create aesthetic, functional reports–all while setting your agency apart from the crowd.

Effortless Updates
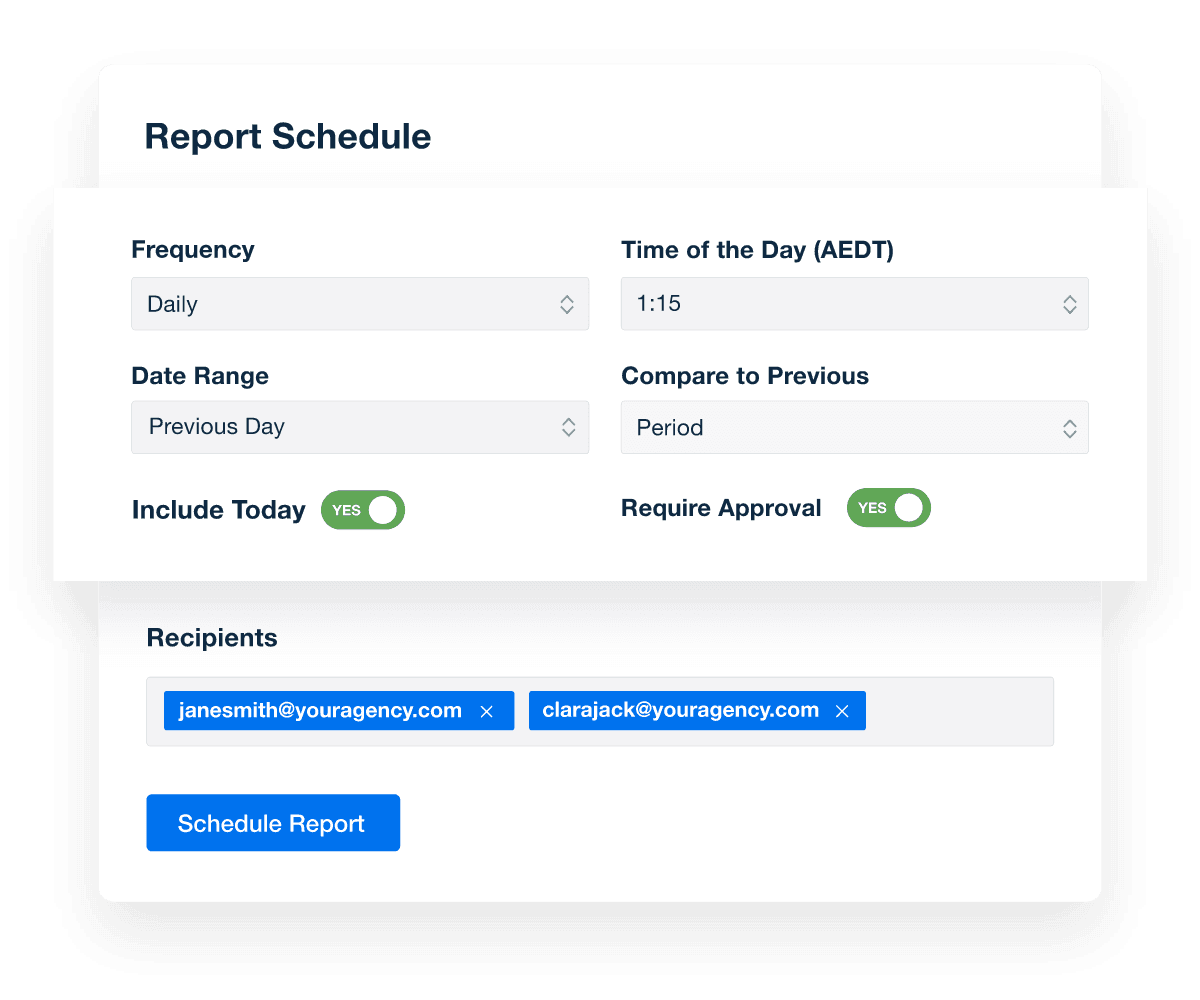
Put Your LinkedIn Reporting on Autopilot
Automatically schedule reports and take one more thing off your to-do list. Ensure your clients get those valuable insights precisely on time.
Set a reporting frequency (like weekly or monthly) and even decide on a specific time. Choose a custom date range and ensure your clients get the data they value most.
Efficiency at Its Best
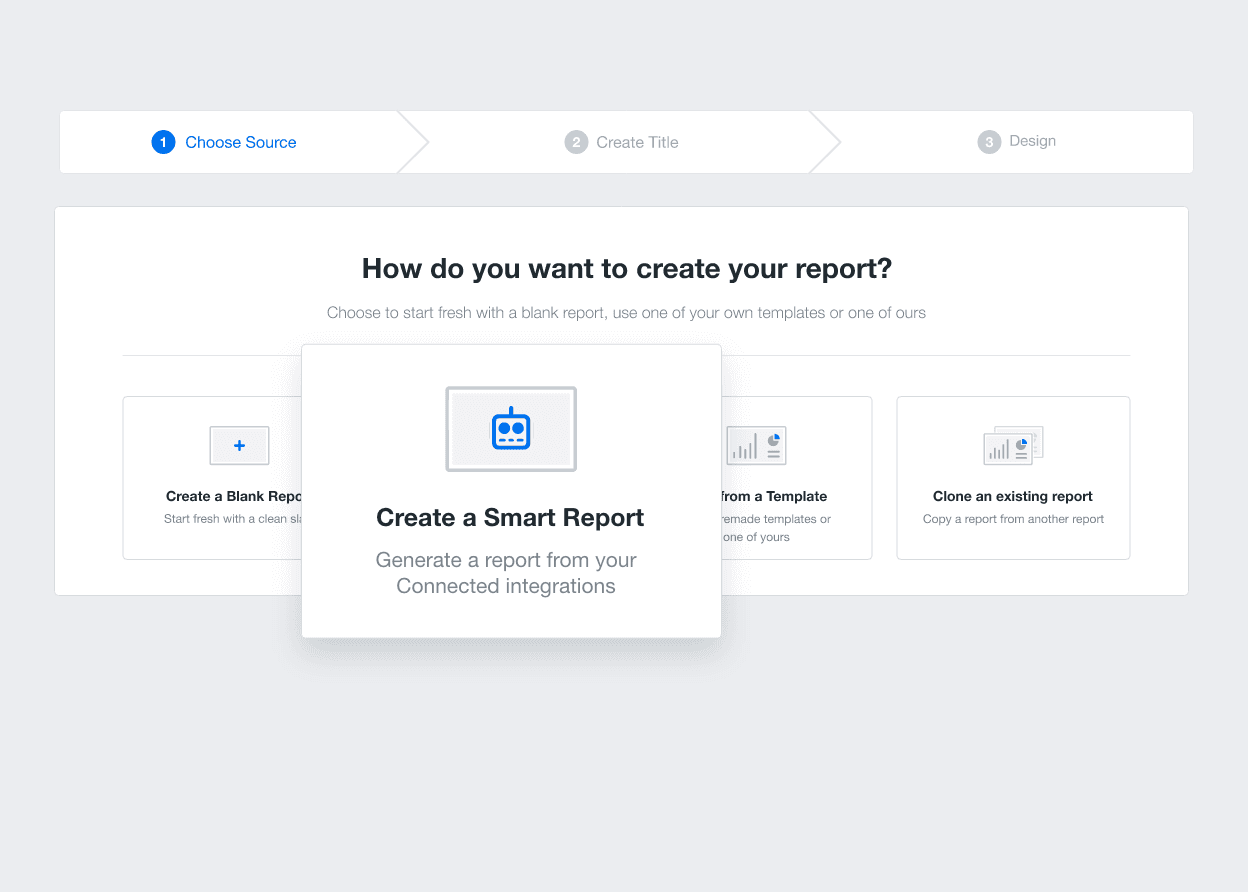
11-Second Smart Reports
Quickly generate an 11-second smart report with your client’s unique LinkedIn analytics. Simply connect your client’s LinkedIn account, click the “Smart Report” option, and let us do the rest.
Need a bit of customization? Add custom metrics, annotations, and goals across 80+ platforms. Reporting has never been easier.
The amount of data you can collect and organize is incredible. All your social media stats, Google stats, etc, etc in one place! And customer support is great.

Brandon Cook
Integrity eMarketing Solutions
More Templates


Get Started for Free
Try AgencyAnalytics risk-free for 14 days. No credit card required.
Use a Customizable LinkedIn Report Template to Streamline Reporting!